Products

Decision tools on open data, free to use.

Each tool answers one practical question, and each is a template for a tool on your own data.

Motion is turned off on this device, so this page shows all five tools as stills.

Five live tools on official open data. Every reading shows where it came from and how old it is.

What is planned, permitted and zoned at this address?

Region Lens. Cities that publish open data in the US and Canada.

Open Region Lens
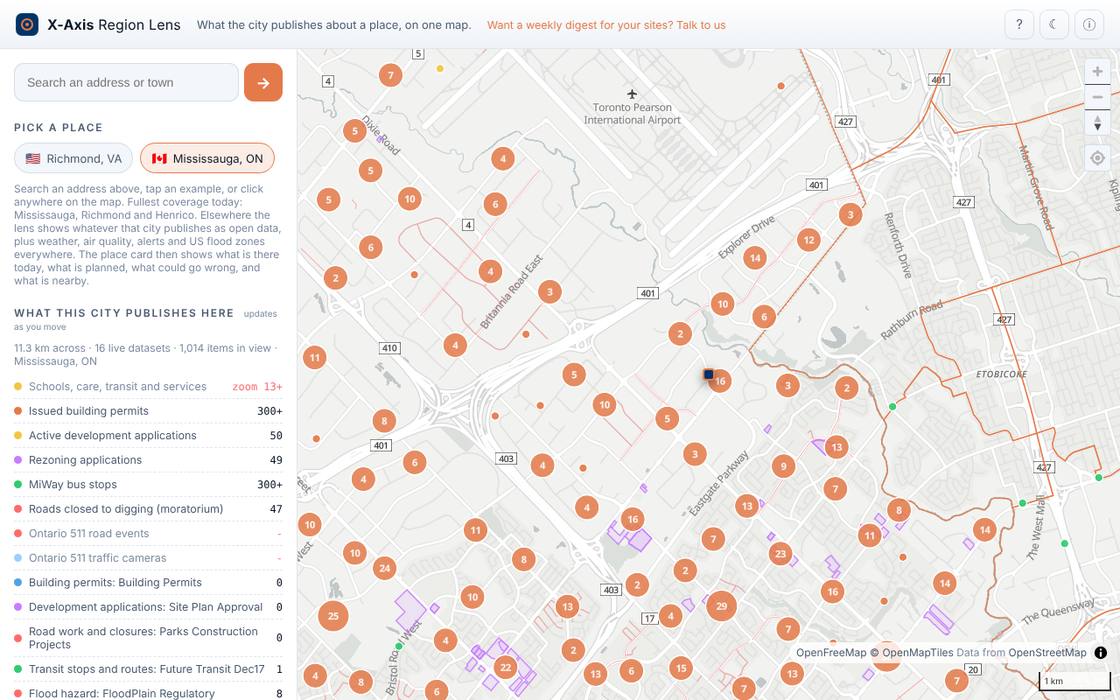
Screenshot of the Region Lens tool

What the city publishes about a place, on one map. Permits and zoning at an address, planned work nearby, the official flood zone, road work, schools and transit.

  • Place card: Right now, This address, Coming up, Nearby
  • What changed since your last visit, per city
  • Save places, weekly digest for your team
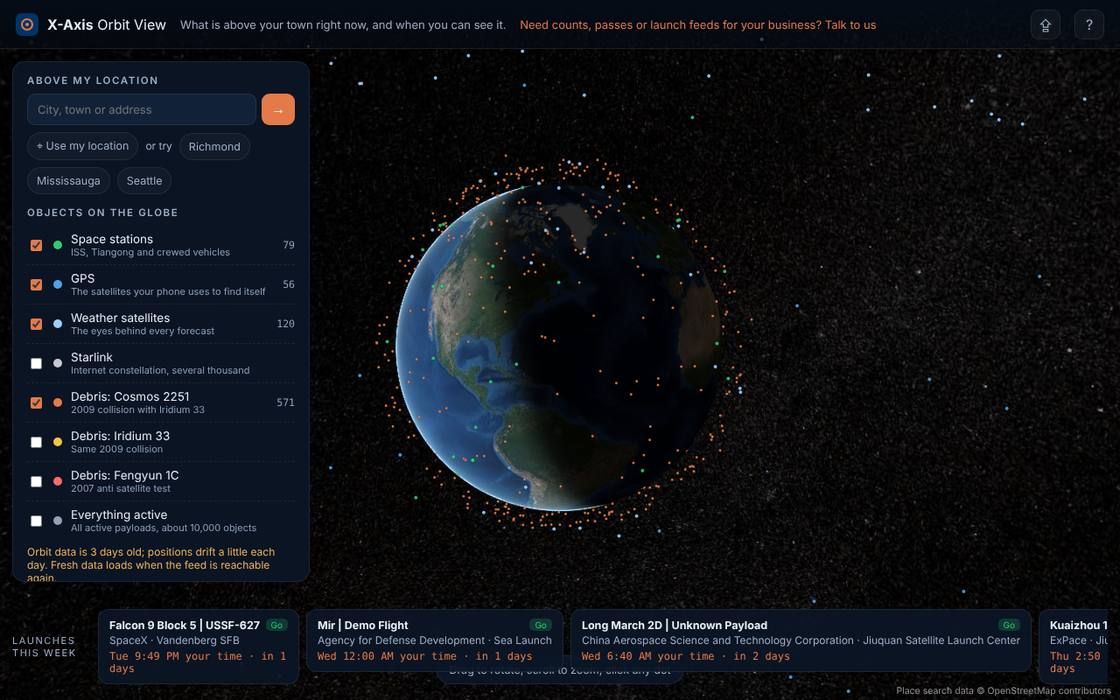
What is above my town right now?

Orbit View. Live tracking, computed on your device.

Open Orbit View
Screenshot of the Orbit View tool

What is above your town right now, and when you can see it. The objects overhead, the GPS satellites in your sky, the nearest debris and the next visible space station pass.

  • Next visible pass with direction and calendar export
  • Launches this week with countdowns
  • Shareable link to any view

Can my crew work outside tomorrow?

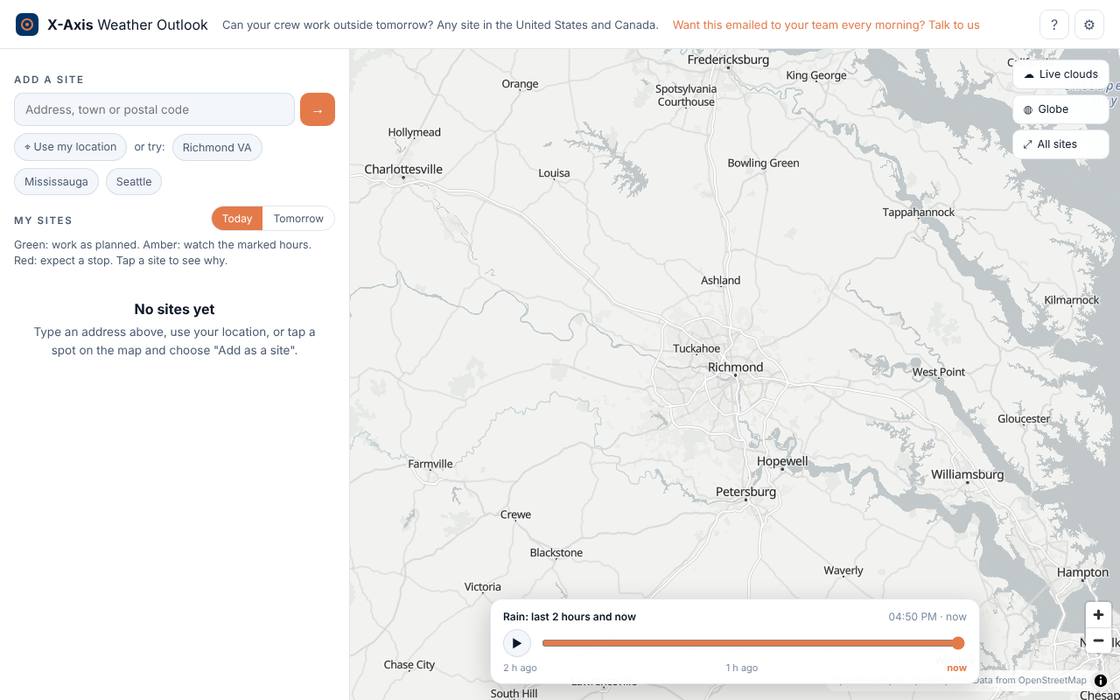
Weather Outlook. Hourly forecast, radar every 10 minutes.

Open Weather Outlook
Screenshot of the Weather Outlook tool

Can your crew work outside tomorrow? Add your sites and get a plain go, caution or stop verdict for today and tomorrow against the wind, rain, heat and cold limits you set.

  • Any site in the US or Canada, metric or imperial
  • Rain radar for the last two hours, official alerts
  • Guided setup for your first site

Which rivers near my sites are rising?

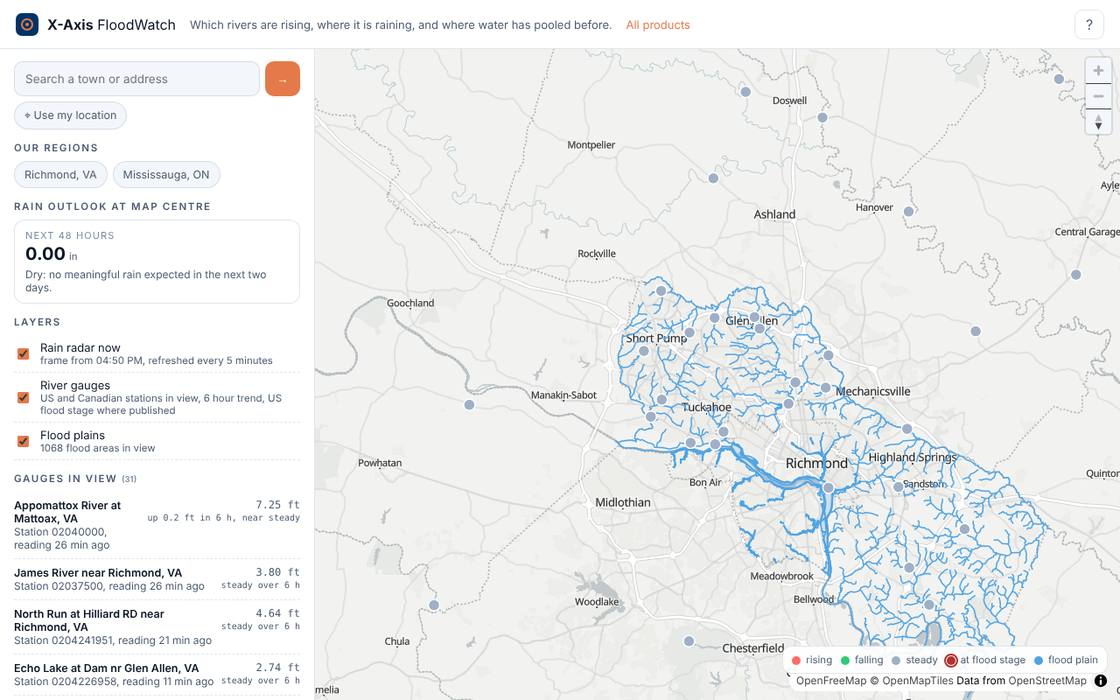
FloodWatch. Live river gauges and flood plains.

Open FloodWatch
Screenshot of the FloodWatch tool

River levels, rainfall and flood plains for a site, a route or a district. See which gauges are rising now and which areas sit in the flood plain.

  • Live river gauges in the United States and Canada
  • Flood plains around your sites
  • Radar rainfall over the same map

Will it be a white Christmas here?

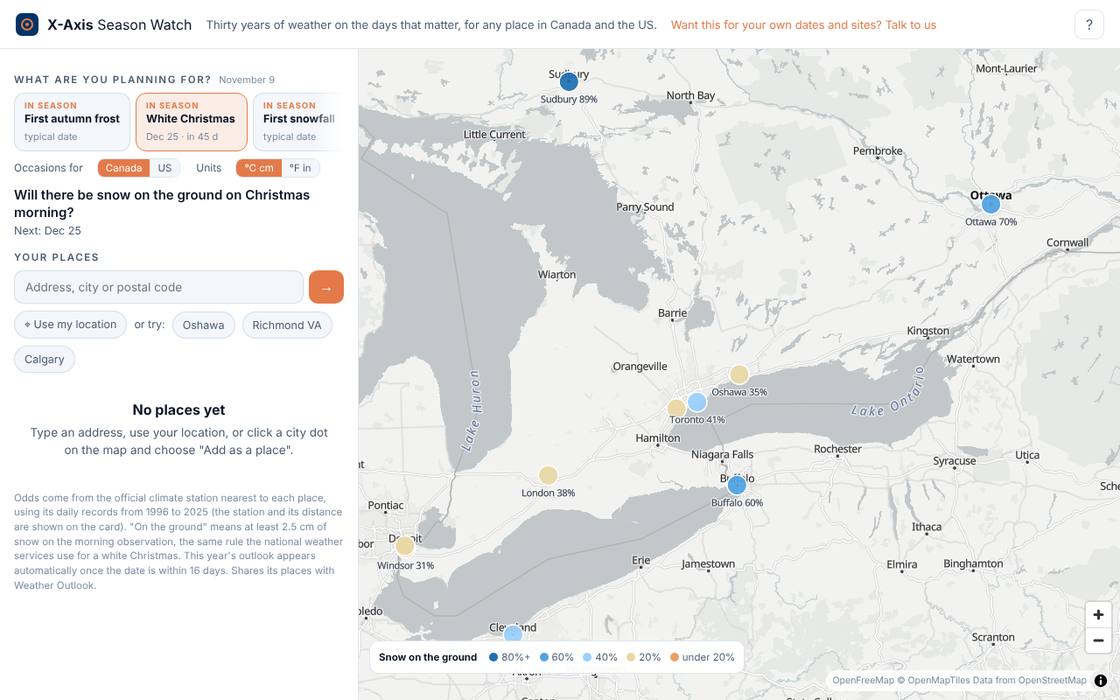
Season Watch. 30 years of station records, forecast within 16 days.

Open Season Watch
Screenshot of the Season Watch tool

Will it be a white Christmas? When does the last frost usually go? Odds for the next occasion on the calendar from decades of station records, with the live forecast added once the day is close.

  • White Christmas odds for any city, year by year
  • Frost, first snow, hot holiday weekends and more
  • Compare your places on one map

How we build these

The same four steps sit behind every product, and behind the custom tools we build for clients.

  1. Source

    We connect to the official feeds and registries that matter for your region, and keep them current.

  2. Connect

    Everything is placed on one map and one clock, so roads, permits, hazards and weather can be asked about together.

  3. Explain

    Every item carries its origin and its freshness. Nothing is shown as more certain than its origin allows.

  4. Act

    Lenses, watches and alerts turn the picture into decisions for residents, operations teams and public bodies.

Custom products, built the same way.

Every product above started as a question: what would it take to see this clearly? We build the same connected tools on private and enterprise data, from asset registers and field reports to sensors and ERP, and we run them for you.